|

Q. 3. A stock broker keeps a daily list of
the number of transactions where his customers buy
the stocks on margin.The following number of stocks
were brought on margin by the customers in January
2000:
(June 2000)
|
50 |
42 |
44 |
42 |
43 |
50 |
|
35 |
37 |
43 |
37 |
25 |
15 |
|
25 |
05 |
09 |
13 |
17 |
19
|
|
18 |
20 |
40 |
29 |
21 |
26 |
|
02 |
17 |
48 |
36 |
12 |
28 |
Construct a frequency distribution for the preceding
data and then draw a histogram with number of classes
= 10.
Solution. Given, the number of class is 10.
Highest Value = 50
Lowest Value = 2
Class size = Range/No. of classes
Where:
Range = Highest Value - Lowest Value
Range = 50 - 2 = 48
Therefore, class size = 48/10 = 4.8 or 5
|
No. of stocks
|
Class frequency |
Tally |
| 2-7 |
2 |
|| |
| 7-12 |
1 |
| |
| 12-17 |
3 |
||| |
| 17-22 |
6 |
||||
| |
| 22-27 |
3 |
||| |
| 27-32 |
2 |
|| |
| 32-37 |
2 |
|| |
| 37-42 |
3 |
||| |
| 42-47 |
5 |
|||| |
| 47-52 |
3 |
||| |
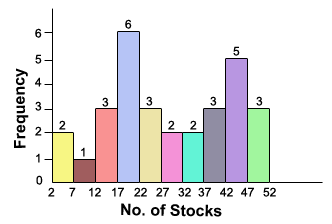
The histogram for the above problem is shown in the
following figure:

|