Graphical Method: Goal Programming
This section deals with geometric representation of a goal programming problem. The graphical method of solving goal programming problem is quite similar to the graphical method of linear programming.
 Graphical Method Example: Goal Programming
Minimize z = P1d1− + 2P2d2− + P2d3− + P3d1+
subject to
x1 + x2 + d1− - d1+ = 450
x1 + d2− = 250
x2 + d3− = 350
x1, x2, d1−, d2−, d3−, d1+ ≥ 0
Solution.
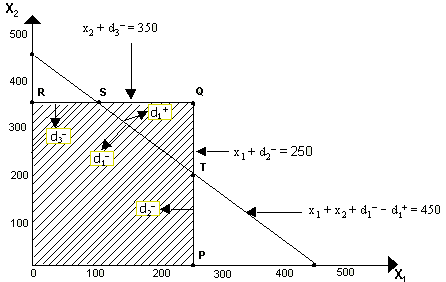
The problem is graphed in the following figure.

The region bounded by OPQR represents the solution set.
The optimal solution to the problem is given below:
x1 = 250, x2 = 350, d1− = 0, d2− = 0, d3− = 0, d1+ = 150


