Graphical Method: Game Theory
The method discussed in the previous section is feasible when the value of n is small, because the larger value of n will yield a larger number of 2 X 2 sub-games.
In this section, we discuss Graphical Method for solving 2 X n games.
This method can only be used in games with no saddle point, and having a pay-off matrix of type n X 2 or 2 X n.
 Example: Graphical Method for Game Theory
Consider the following pay-off matrix
| Player A | Player B | ||
|---|---|---|---|
| B1 | B2 | ||
| A1 | -2 | 4 | |
| A1 | 8 | 3 | |
| A1 | 9 | 0 | |
Solution.
The game does not have a saddle point as shown in the following table.
| Player A | Player B | Minimum | Probability | ||
|---|---|---|---|---|---|
| B1 | B2 | ||||
| A1 | -2 | 4 | -2 | q1 | |
| A2 | 8 | 3 | 3 | q2 | |
| A3 | 9 | 0 | 0 | q3 | |
| Maximum | 9 | 4 | |||
| Probability | p1 | p1 | |||
Maximin = 4, Minimax = 3
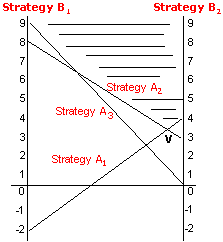
First, we draw two parallel lines 1 unit distance apart and mark a
scale on each. The two parallel lines represent strategies of player
B.
If player A selects strategy A1, player B can win –2 (i.e., loose 2
units) or 4 units depending on B’s selection of strategies. The value
-2 is plotted along the vertical axis under strategy B1 and
the value 4 is plotted along the vertical axis under strategy B2.
A straight line joining the two points is then drawn.
Similarly, we can plot strategies A2 and A3 also.
The problem is graphed in the following figure.

The lowest point V in the shaded region indicates the value of game. From the above figure, the value of the game is 3.4 units. Likewise, we can draw a graph for player B.
The point of optimal solution (i.e., maximin point) occurs at the intersection of two lines:
E1 = -2p1 + 4p2 and
E2 = 8p1 + 3p2
Comparing the above two equations, we have
-2p1 + 4p2 = 8p1 + 3p2
Substituting p2 = 1 - p1
-2p1 + 4(1 - p1) = 8p1 + 3(1
- p1)
p1 = 1/11
p2 = 10/11
Substituting the values of p1 and p2 in equation E1
V = -2 (1/11) + 4 (10/11) = 3.4 units


